
Near Real-Time Ionospheric Scintillation Maps
Welcome to the Transionospheric Radio Link - Near-real-time Ionospheric Scintillation Maps service
Overview
Trans-ionospheric radio signals of global navigation satellite systems (GNSS) like GPS, GLONASS, and GALILEO may suffer from rapid and intensive fluctuations of their amplitude and phase caused by small-scale irregularities of the ionospheric plasma. This phenomenon, which is called radio scintillation, can strongly disturb or disrupt the signal transmission. For technical applications it is useful to derive and to provide the well accepted S4 and σΦ indices describing the amplitude/ intensity and the phase fluctuation of a received signal, respectively. For that purpose GNSS high-rate receivers in Europe provide necessary receiver-satellite-link specific amplitude and phase information.
This service provides near-real-time local scintillation data as well as regional and global maps. Additionally, solar and geomagnetic indices are provided, applicable for forecast or background models.
Read more about this service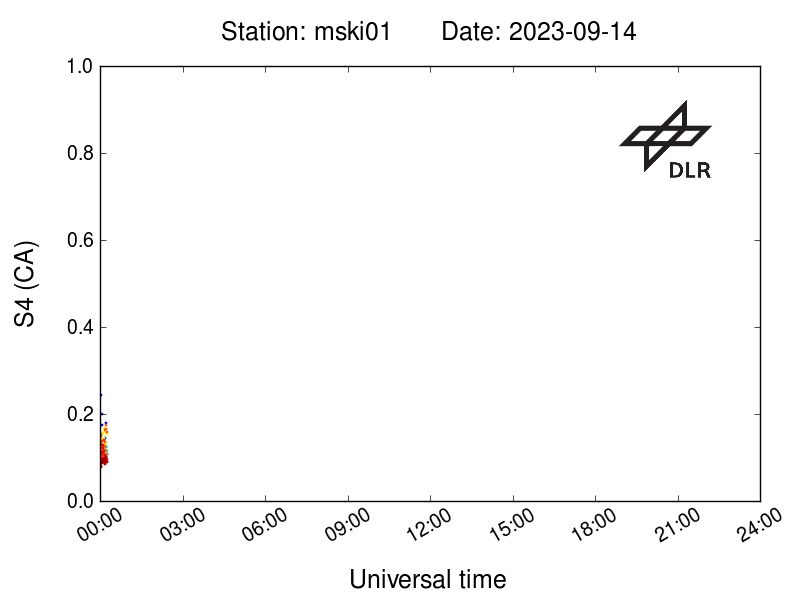
Highlights
Announcements
💡Let us know what you think about our services in our Survey.
Products and Alerts
The following products are associated with this service:Products
Nowcast of Scintillation Indices
Scintillation Indices and Parameters
- Global Scintillation Indices
- S4 maps (Northern Europe)
- σφ maps (Northern Europe)
- S4 nowcast modelled maps
- SigmaPhi nowcast modelled maps
- S4 nowcast modelled values at a given location
- SigmaPhi nowcast modelled values at a given location
- Ionospheric scintillation activity nowcast for the Arctic region
Forecast of Scintillation Indices
Other Ionosphere Nowcast
Vertical Total Electron Content Map
- TEC map (Europe), current
- TEC map (Global), current
- VTEC maps (Northern Europe)
- IONMON TEC maps
- EIS Near real-time TEC maps for the European region
- TEC nowcast modelled maps
- TEC nowcast modelled values at a given location
- Nowcasting of TEC over Italy
- AIDA Global Map Nowcasts of vertical Total Electron Content (vTEC)
3D Electron Density Grids
URSI Ionospheric Parameters
Other Ionosphere Forecast
Vertical Total Electron Content Map
3D Electron Density Grids
URSI Ionospheric Parameters
- EIS European maps of foF2 long term predictions
- EIS Maps of forecasted foF2 over Europe for the next 24 hours
- EIS Forecasted foF2 values for the next 24 hours over each ionosonde
- Short Term Forecasting of MUF(3000)F2 over Europe
- Short Term Forecasting of MUF(3000)F2 ratio over Europe
- AIDA Global Forecasts of Ionospheric Parameters
Riometer Data
No product available in this category yet
Solar Data Nowcast
Solar Flares
- UGraz/KSO Latest Solar flare detections
- UGraz/KSO Solar flare detection archive
- SIDC Solarmap
- SIDC Solarmap
- SIDC Latest daily space weather bulletin
- SIDC Daily space weather bulletin archive
- SIDC Latest Solar EUV flare detection
- SIDC Solar EUV flare detection archive
- SIDC Latest Moderated Solar Weather Event list
- SIDC Moderated Solar Weather Event list archive
- ASUCAS/SPS Latest Daily space weather bulletin
- ASUCAS/SPS Daily space weather bulletin archive
Smoothed Sunspot Number (SSN, R12)
No product available in this category yet
10.7cm Solar Radio Flux (F10.7)
Solar X-ray Flux
Solar EUV Integrated Flux
No product available in this category yet
Solar UV Flux
No product available in this category yet
Solar Data Forecast
Solar Flares
- S.109e-lst
- S.109e-arv
- A-EFFort Latest Solar flare forecast
- A-EFFort Solar flare forecast archive
- SIDC Latest Solar flare forecast
- SIDC Solar flare forecast archive
- SIDC Latest daily space weather bulletin
- SIDC Daily space weather bulletin archive
- ASUCAS/SPS Latest Solar flare forecast
- ASUCAS/SPS Solar flare forecast archive
- ASUCAS/SPS Latest Daily space weather bulletin
- ASUCAS/SPS Daily space weather bulletin archive
- UKMO Latest Solar flare forecast
Smoothed Sunspot Number (SSN, R12)
10.7cm Solar Radio Flux (F10.7)
- CLS F10.7 and F30 nowcast & forecast
- CLS F10.7 and F30 nowcast & forecast archive
- UGraz/KSO Latest F10.7 and F30 forecasts
- UGraz/KSO F10.7 and F30 forecasts archive
- SIDC Latest 10.7cm Solar radio flux (F10.7) forecast
- SIDC 10.7cm Solar radio flux (F10.7) forecast archive
- F10.7 Index Forecast 27-day/BGS
- F10.7 Index Forecast multi-year
- F10.7 Index Forecast 27-day/SWPC
- F10.7 Index Forecast 45-day
- F10.7 Index Forecast 30-day Absolute
- F10.7 Index Forecast 30-day Adjusted
Solar X-ray Flux
No product available in this category yet
Solar EUV Integrated Flux
No product available in this category yet
Solar UV Flux
No product available in this category yet
Geomagnetic Indices, nowcast
Local External Magnetic Field on Ground
Local Geomagnetic Induced Geoelectric Field
- Horizontal electric field data (UK)
- Peak Geomagnetically Induced Current (GIC) for Scotland, England, Wales and the UK
- Average Geomagnetically Induced Current (GIC) for Scotland, England, Wales and the UK
- Peak Pipe-to-Soil Potential (PSP) for Scotland, England, Wales and the UK
- Average Pipe-to-Soil Potential (PSP) for Scotland, England, Wales and the UK
- 3-hourly Telluric index (Lerwick, Eskdalemuir, Hartland)
- GIC Index, Bgic for the UK
- Modelled surface electric field for UK and Ireland
- Maps for power and pipeline operators
- Table of modelled GIC
- Pipe-to-soil voltage (PSV)
Geomagnetic Indices, forecast
Local External Magnetic Field on Ground
Local Geomagnetic Induced Geoelectric Field
No product available in this category yet
Tools
User Manual
Radio wave scintillations are an indicator for ionospheric irregularities in the electron density.
MoreInterruptions
None


