
Near Real-Time TEC Maps
Welcome to the Transionospheric Radio Link - Near-real-time TEC maps service
Overview
The service "Transionospheric Radio Link - Near-real-time TEC maps" aims to provide maps of the Total Electron Content (TEC) no more than 5 minutes after observation (near-real-time). Supplementary materials are measurements from ionosondes (URSI parameters), height of maximum electron density in the F2 layer (hmF2). The Smoothed Sunspot Number (SSN) and the solar flux density from the entire solar disk at 10.7 cm (F10.7) are solar parameters contributing to this service. They are proportional to the level of ionisation in the ionosphere and therefore commonly used for TEC models.
This service addresses the needs of trans-ionospheric radio links users. This includes primarily Global Navigation Satellite System (GNSS) users and service providers, using GNSS single frequency services (e.g. EGNOS users and typical GNSS mass market users), GNSS multi-frequency services (e.g. aeronautical systems, geodetic users, Real-Time Kinematik) and users of satellite data communications (e.g. Search and Rescue, Air Traffic, etc.) and other space-based services affected by the ionosphere (e.g. radars, altimetry, radioastronomy, etc.).
Read more about this service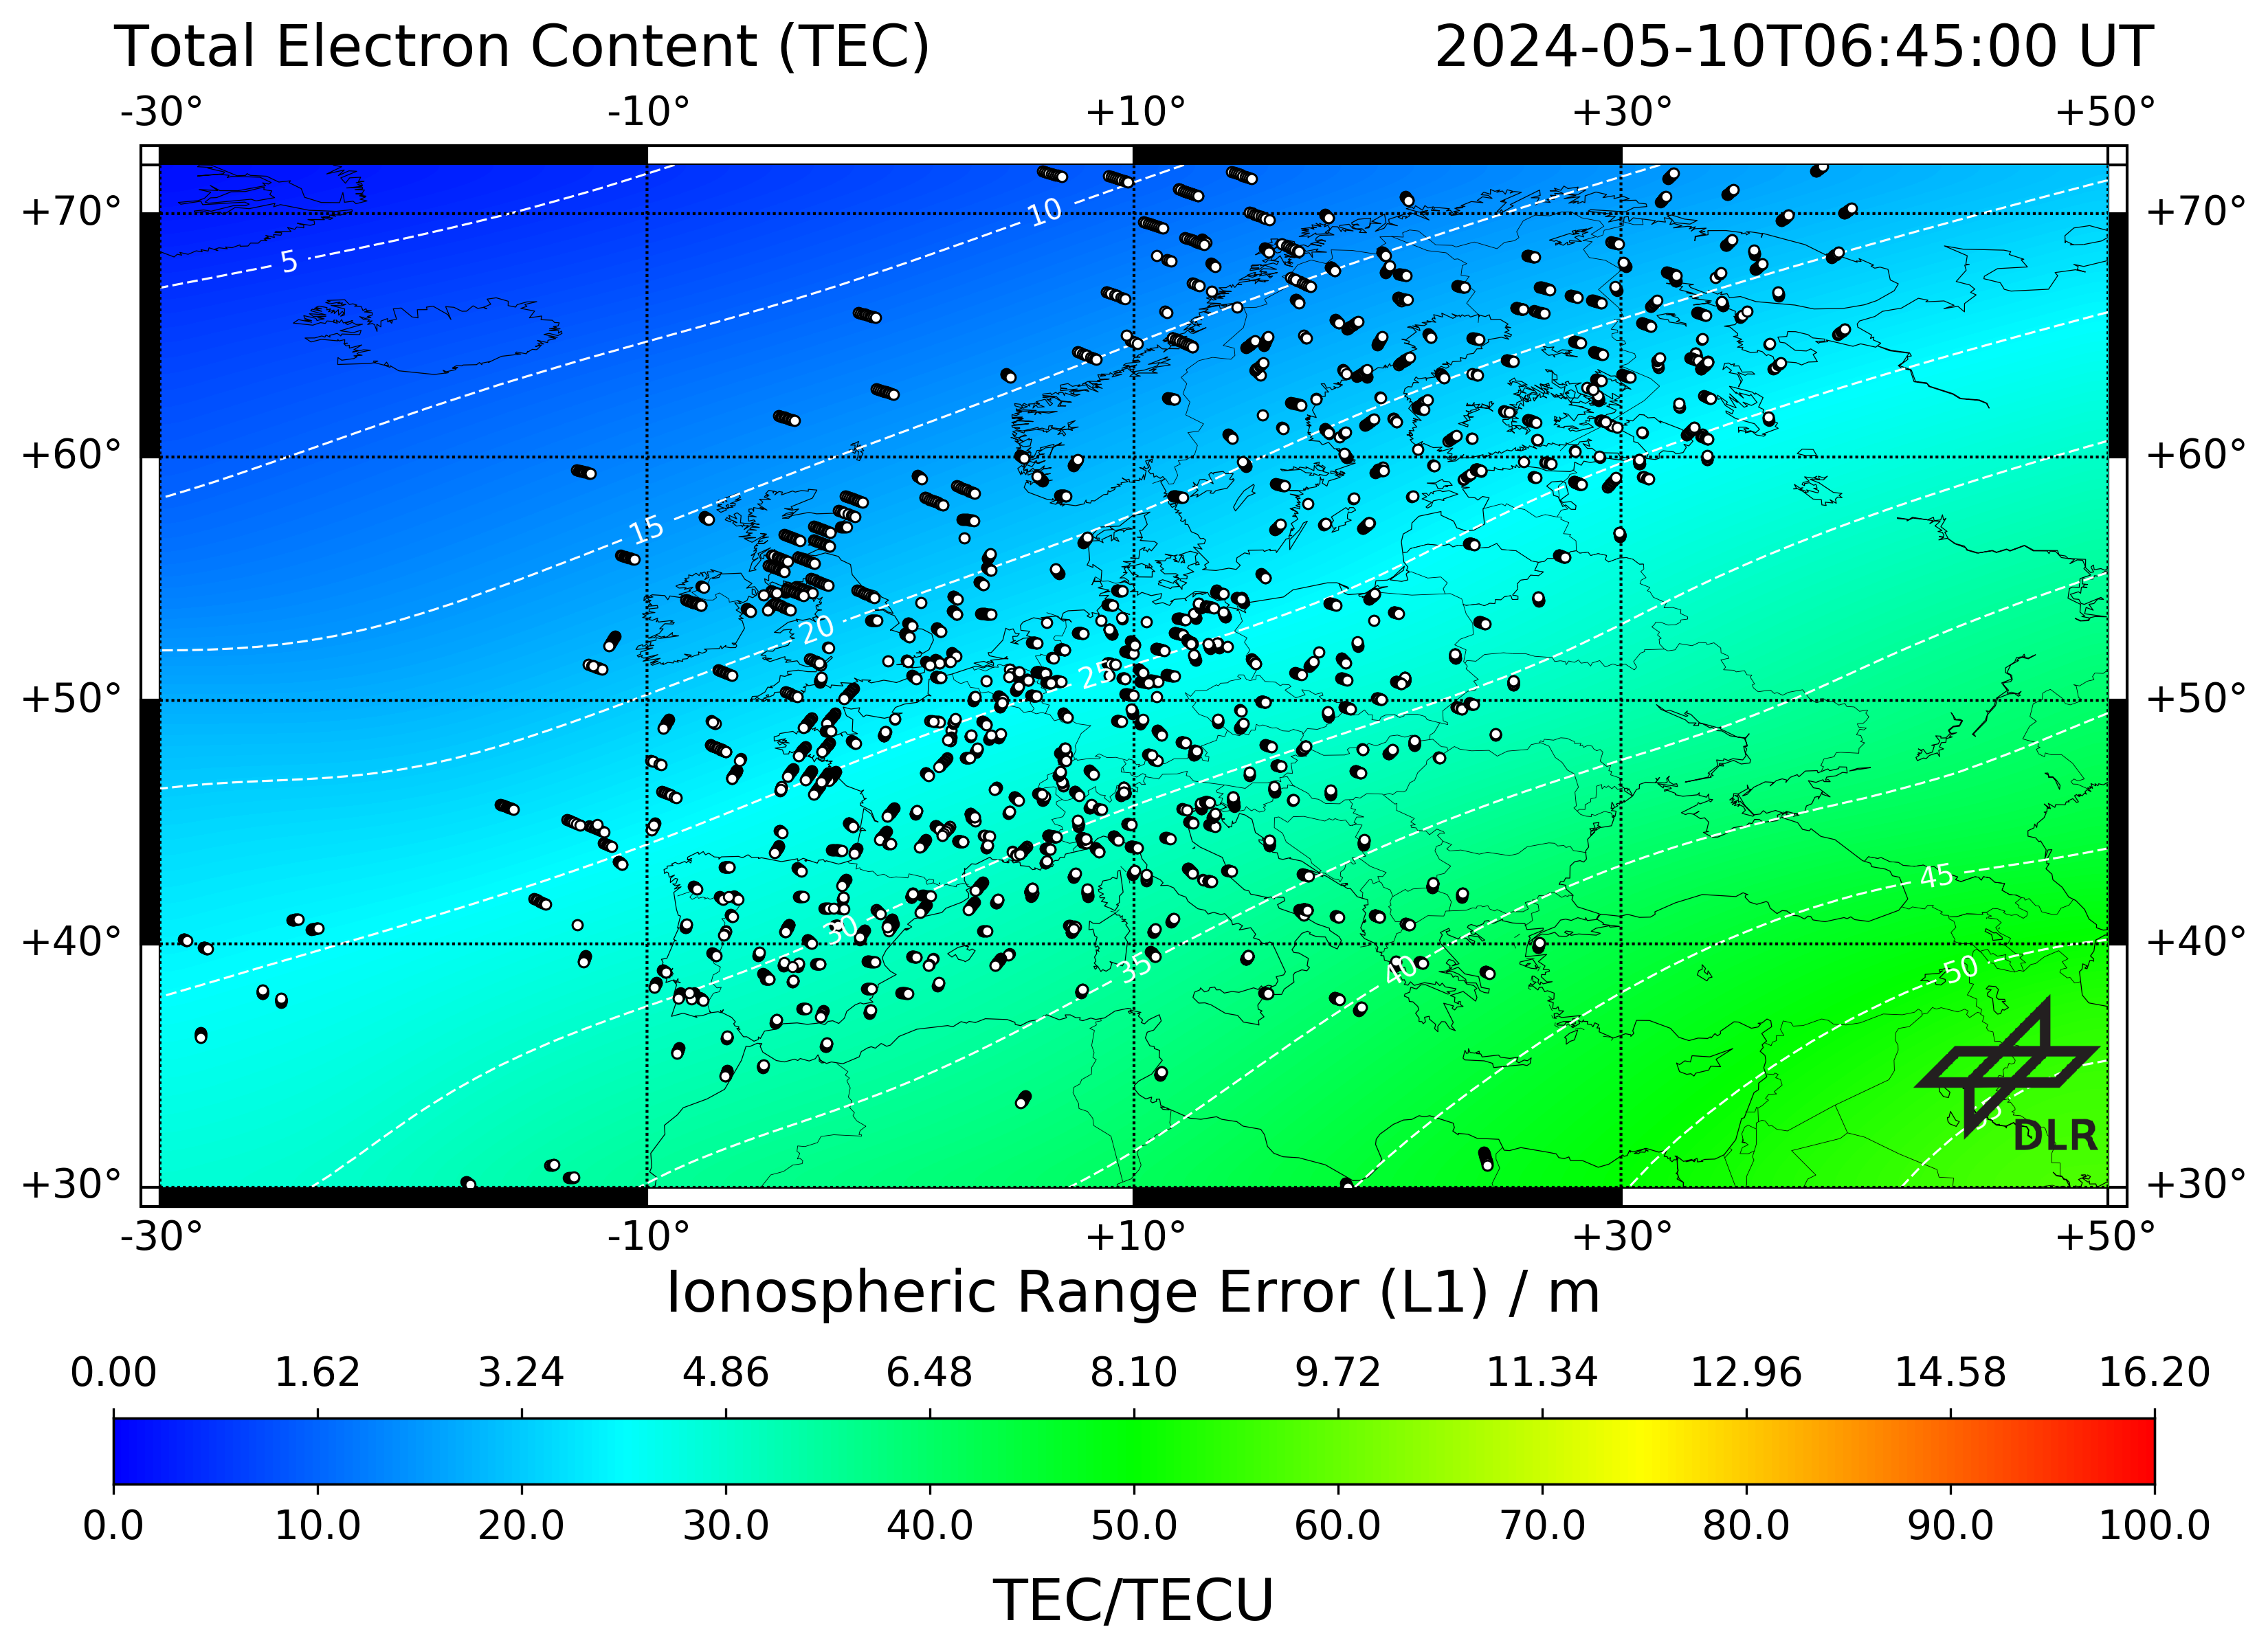
Highlights
Announcements
💡Let us know what you think about our services in our Survey.
Products and Alerts
The following products are associated with this service:Products
Total Electron Content Maps, Nowcast
Vertical Total Electron Content Map
3D Electron Density Grids
URSI ionospheric parameter values, Nowcast
Scintillation, Nowcast
Riometer, Nowcast
Solar Data, Nowcast
Solar Flares
- UGraz/KSO Latest Solar flare detections
- UGraz/KSO Solar flare detection archive
- SIDC Solarmap
- SIDC Solarmap
- SIDC Latest daily space weather bulletin
- SIDC Daily space weather bulletin archive
- SIDC Latest Solar EUV flare detection
- SIDC Solar EUV flare detection archive
- SIDC Latest Moderated Solar Weather Event list
- SIDC Moderated Solar Weather Event list archive
- ASUCAS/SPS Latest Daily space weather bulletin
- ASUCAS/SPS Daily space weather bulletin archive
Smoothed Sunspot Number (SSN, R12)
No product available in this category yet
10.7cm Solar Radio Flux (F10.7)
Solar X-ray Flux
Solar EUV Integrated Flux
No product available in this category yet
Solar UV Flux
No product available in this category yet
Geomagnetic Storm Indices, Nowcast
Local External Magnetic Field on Ground
Local Geomagnetic Induced Geoelectric Field
- Horizontal electric field data (UK)
- Peak Geomagnetically Induced Current (GIC) for Scotland, England, Wales and the UK
- Average Geomagnetically Induced Current (GIC) for Scotland, England, Wales and the UK
- Peak Pipe-to-Soil Potential (PSP) for Scotland, England, Wales and the UK
- Average Pipe-to-Soil Potential (PSP) for Scotland, England, Wales and the UK
- 3-hourly Telluric index (Lerwick, Eskdalemuir, Hartland)
- GIC Index, Bgic for the UK
- Modelled surface electric field for UK and Ireland
- Maps for power and pipeline operators
- Table of modelled GIC
- Pipe-to-soil voltage (PSV)
Alerts
Ionospheric Disturbance Detection
Tools
User Manual
The Total Electron Content (TEC) is defined as the integral of the electron density along the ray path between satellite and receiver. Thus, TEC provides the number of electrons per square metre. The most frequently used unit is 1TECU = 1x10¹⁶ electrons / m2.
MoreInterruptions
None
