
Service to Pipeline Operators
Welcome to the Service to pipeline operators service
Overview
Geomagnetically induced currents (GIC) in technological systems are caused by rapid variations of the geomagnetic field (dB⁄dt) which are always associated with a geoelectric field driving currents in electric conductors. They can disturb the normal operation of pipelines by creating fluctuations in corrosion protection voltages and in the long term by possibly increasing the corrosion rate of the pipeline steel. Real-time monitoring of GIC can be based on ground magnetic field recordings from which GIC can be modelled. Short-term forecasts can be based on the estimated rate of change of the geomagnetic field (dB⁄dt), which provides a proxy for GIC.
The purpose of this service is to give a general overview of GIC and pipe-to-soil voltage (PSV) activity.
Read more about this service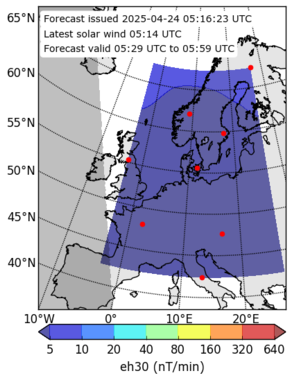
Highlights
Announcements
💡 Let us know what you think about our services in our Survey.
Products and Alerts
Products
Interplanetary medium at L1
Interplanetary Magnetic Field (IMF)
Solar Wind Bulk Velocity
- Near-Earth solar wind forecasts (WSA-Enlil + Ensemble)
- Empirical solar wind speed forecast
- Empirical solar wind speed forecast
- Solar wind speed forecast (STEREO-A persistence model)
- AWARE_NEXT Enhanced 24 hour solar wind forecast
- SWiFT
- Solar Wind Forecast Speed Comparison
- Near-Earth NRT solar wind (DSCOVR)
- SIDC Daily space weather bulletin archive
- SIDC Latest daily space weather bulletin
Solar Wind Bulk Density
Earth magnetosphere
AZ index
Earth atmosphere and geomagnetic environment
Local External Magnetic Field on Ground
Local Geomagnetic Induced Geoelectric Field
- Maps for power and pipeline operators
- Table of modelled GIC
- Pipe-to-soil voltage (PSV)
- Horizontal electric field data (UK)
- Peak Geomagnetically Induced Current (GIC) for Scotland, England, Wales and the UK
- Average Geomagnetically Induced Current (GIC) for Scotland, England, Wales and the UK
- Peak Pipe-to-Soil Potential (PSP) for Scotland, England, Wales and the UK
- Average Pipe-to-Soil Potential (PSP) for Scotland, England, Wales and the UK
- 3-hourly Telluric index (Lerwick, Eskdalemuir, Hartland)
- GIC Index, Bgic for the UK
- Modelled surface electric field for UK and Ireland
Tools
User Manual
To assess in detail the magnitude of possible disturbances in pipelines, the products for Local Geoelectric Field include maps for power and pipeline operators. These can be found from the "Products" section under the "Earth atmosphere and geomagnetic environment" section header. The products also include a table of modelled ground induced current (GIC) and the pipe-to-soil voltage (PSV). At the moment, the coverage of the PSV is limited to the Finnish natural gas pipeline and UK pipelines, and the modelled GIC contains information only for Norwegian and Finnish power grids.
MoreInterruptions
None