
Monitoring and Forecast of Ionospheric Disturbances
Welcome to the Transionospheric Radio Link - Monitoring and Forecast of Ionospheric Disturbances service
Overview
The service "Transionospheric Radio Link - Monitoring and Forecast of Ionospheric Disturbances" aims to provide an estimate of the occurrence risk of ionospheric disturbances, including monitoring and detection of ionospheric phenomena causing local disturbances of electron density and detection of geomagnetic storms. This service is currently under development. The aim is to consider the following ionospheric phenomena:
- trough,
- Travelling Ionospheric Disturbances (TIDs),
- patches,
- depletions and
- D-region absorption.
Currently, this service provides vertical TEC maps, URSI ionospheric parameters and ionospheric perturbation products like the equivalent slab thickness and Rate Of Change of TEC Index (ROTI).
Read more about this service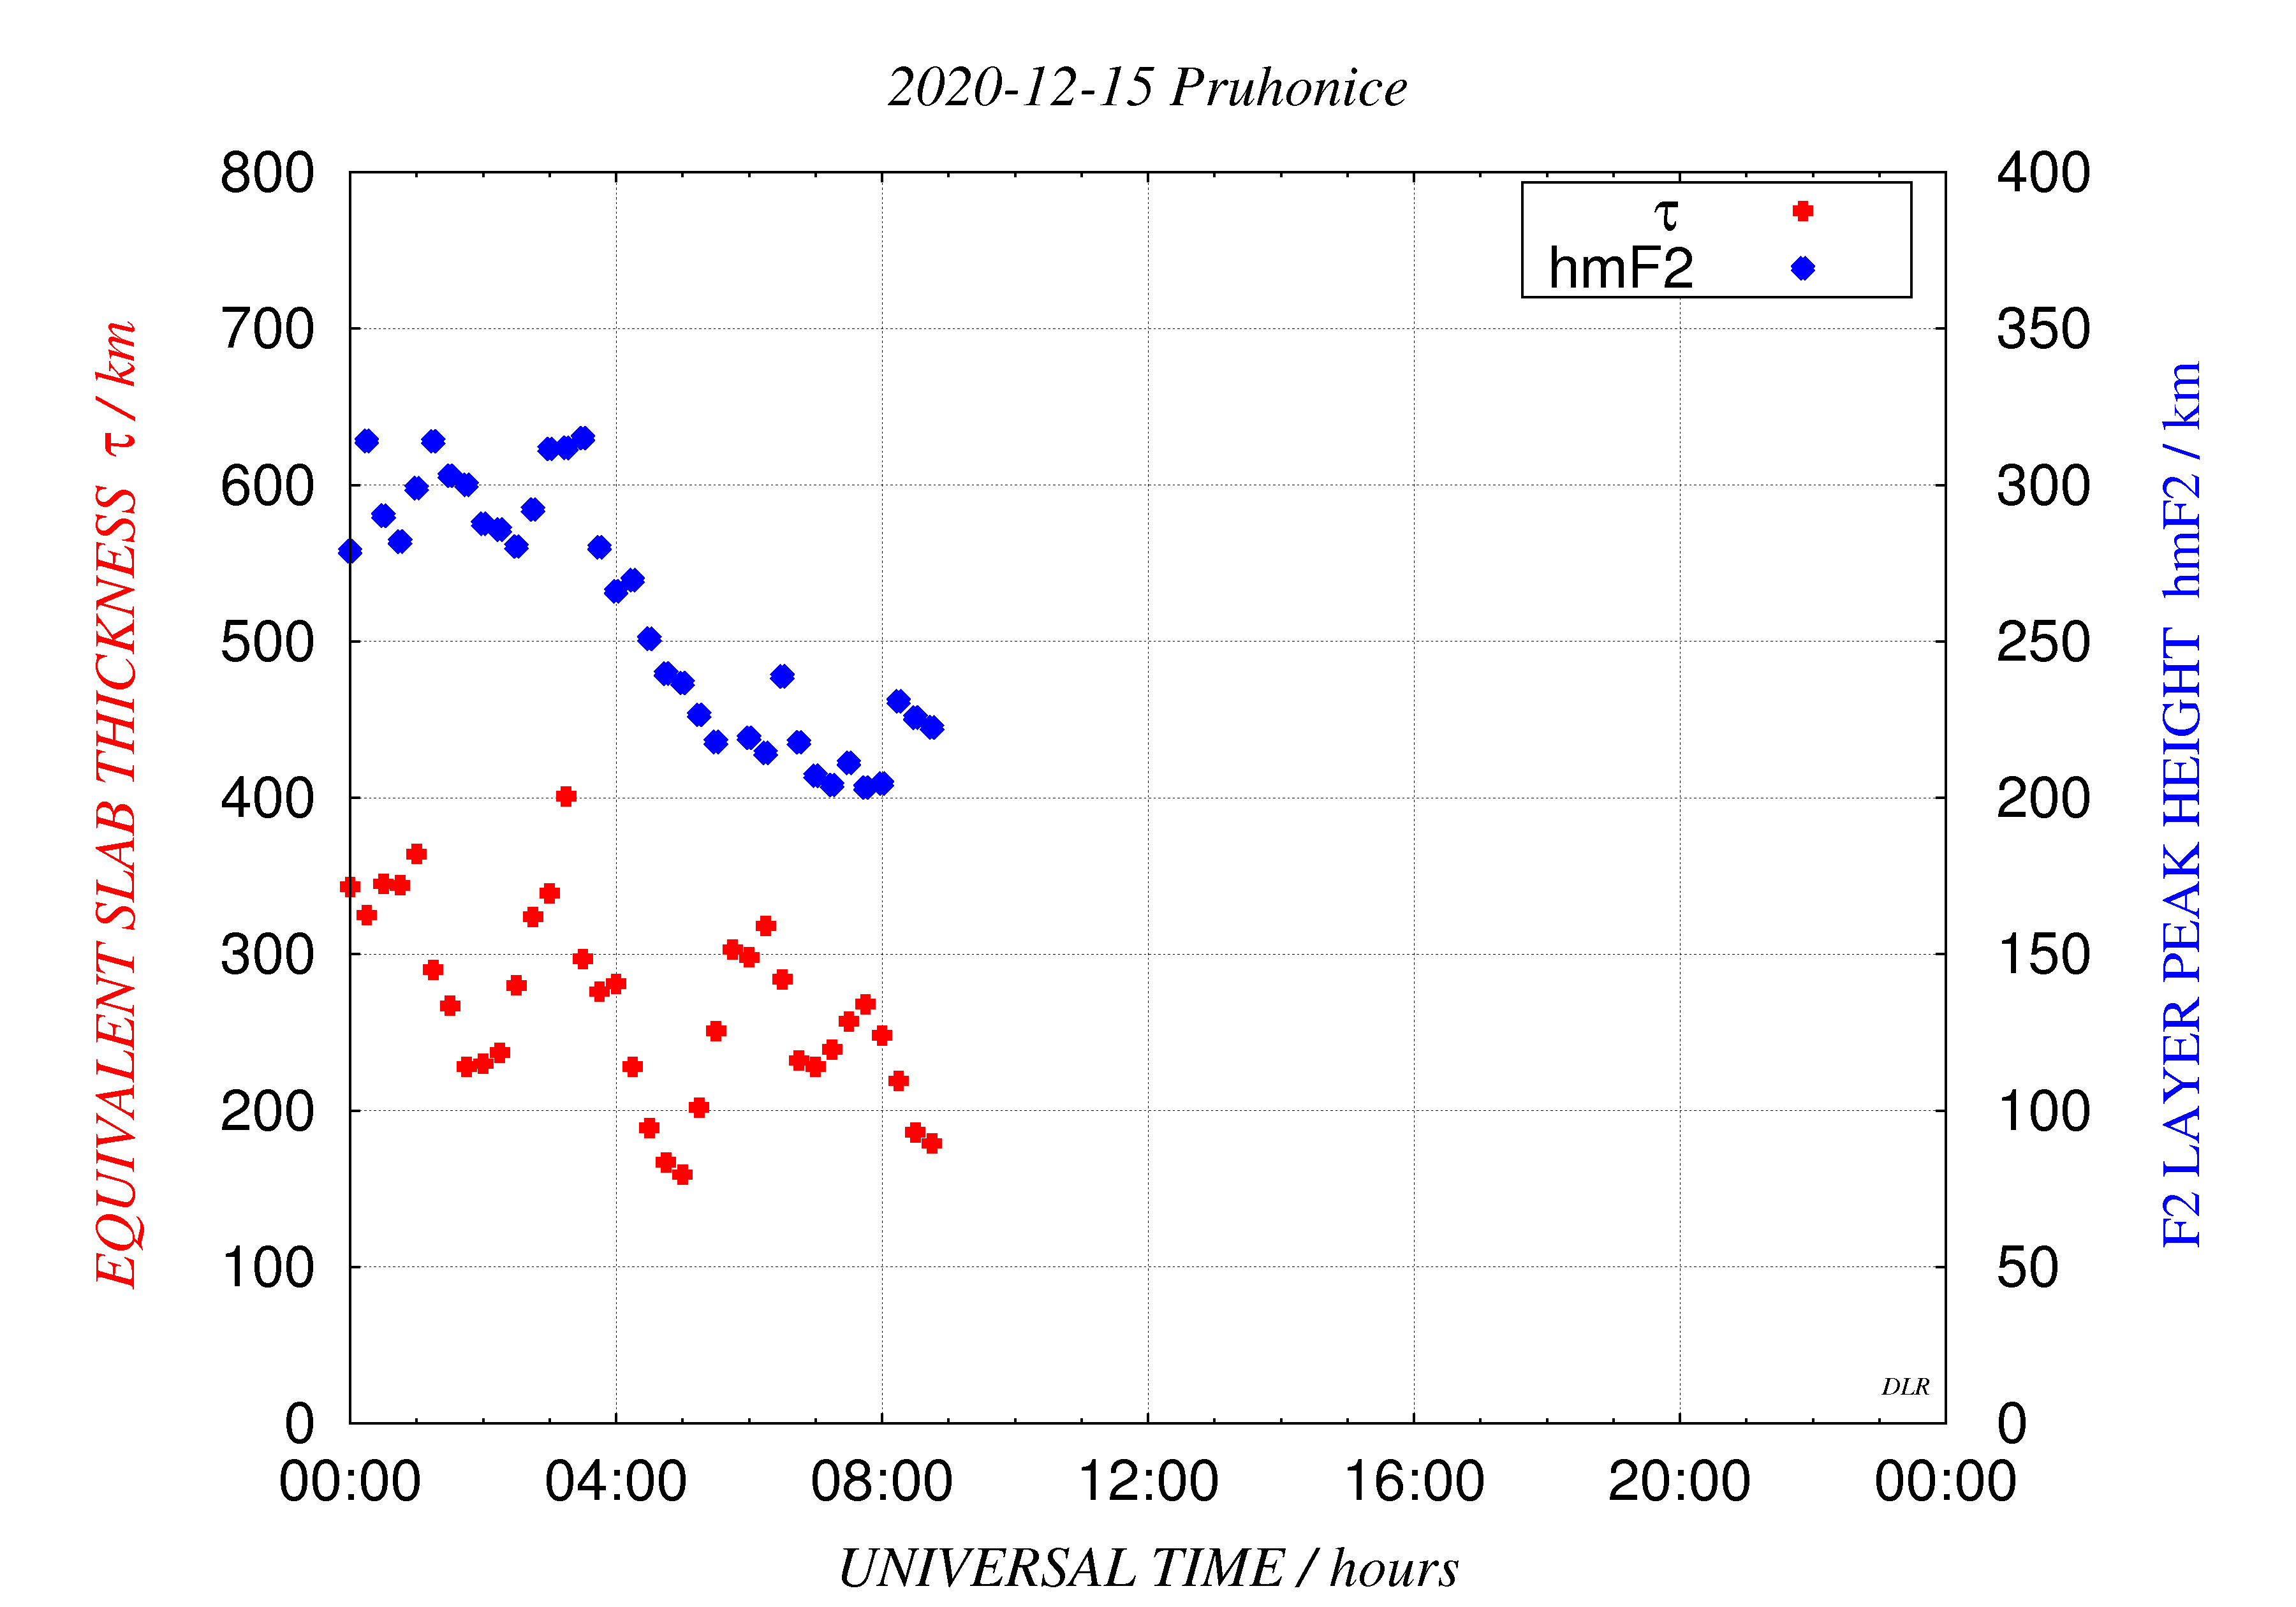
Highlights
Announcements
💡Let us know what you think about our services in our Survey.
Products and Alerts
The following products are associated with this service:Products
Ionospheric Disturbances Nowcast
Ionospheric Disturbances
- Equivalent slab thickness, Juliusruh
- Equivalent slab thickness, Pruhonice
- ROTI maps for Europe
- Maximum Usable Frequency for skip-distances of 750 km (MUF750)
- GIVE maps (Northern Europe)
- ROTI maps (Northern Europe)
- ROTI@Ground maps (Fennoscandia)
- EIS Alerts for ionospheric disturbances in the European sector
- EIS Current Ionospheric Conditions at each ionosonde location
- Swarm Rate Of change of TEC (ROT)
- Swarm Ionospheric Bubble Index (IBI)
- Swarm Rate Of change of TEC Index (ROTI)
- SISTED
- SOLERA-drift
- SOLERA
- SISTED warning
- SOLERA-drift warning
- GNSS Performance Indicator
- TechTIDE GNSS TEC gradient
- TechTIDE LSTID detector maps
- TechTIDE LSTID parameters over station
- TechTIDE LSTID activity index
- TechTIDE AATR indicator maps
- TechTIDE AATR indicator daily plots
- TechTIDE Medium Scale Travelling Ionospheric Disturbances (MSTID) detection for Czech Republic, Doppler system based
- TechTIDE MSTID index maps
- TechTIDE MSTID index daily plots
- TechTIDE TID Activity Report
Ionosphere, Nowcast
Vertical Total Electron Content Map
3D Electron Density Grids
URSI Ionospheric Parameters
Ionosphere, Forecast
Vertical Total Electron Content Map
3D Electron Density Grids
No product available in this category yet
URSI Ionospheric Parameters
Riometer Data
No product available in this category yet
Solar indices Nowcast
Solar Flares
- UGraz/KSO Latest Solar flare detections
- UGraz/KSO Solar flare detection archive
- SIDC Solarmap
- SIDC Solarmap
- SIDC Latest daily space weather bulletin
- SIDC Daily space weather bulletin archive
- SIDC Latest Solar EUV flare detection
- SIDC Solar EUV flare detection archive
- SIDC Latest Moderated Solar Weather Event list
- SIDC Moderated Solar Weather Event list archive
- ASUCAS/SPS Latest Daily space weather bulletin
- ASUCAS/SPS Daily space weather bulletin archive
Smoothed Sunspot Number (SSN, R12)
No product available in this category yet
10.7cm Solar Radio Flux (F10.7)
Solar X-ray Flux
Solar EUV Integrated Flux
No product available in this category yet
Solar UV Flux
No product available in this category yet
Solar indices, Forecast
Solar Flares
- FLARECAST Solar flare forecast
- FLARECAST Solar flare forecast
- A-EFFort Latest Solar flare forecast
- A-EFFort Solar flare forecast archive
- SIDC Latest Solar flare forecast
- SIDC Solar flare forecast archive
- SIDC Latest daily space weather bulletin
- SIDC Daily space weather bulletin archive
- ASUCAS/SPS Latest Solar flare forecast
- ASUCAS/SPS Solar flare forecast archive
- ASUCAS/SPS Latest Daily space weather bulletin
- ASUCAS/SPS Daily space weather bulletin archive
- UKMO Latest Solar flare forecast
Smoothed Sunspot Number (SSN, R12)
10.7cm Solar Radio Flux (F10.7)
- CLS F10.7 and F30 nowcast & forecast
- CLS F10.7 and F30 nowcast & forecast archive
- UGraz/KSO Latest F10.7 and F30 forecasts
- UGraz/KSO F10.7 and F30 forecasts archive
- SIDC Latest 10.7cm Solar radio flux (F10.7) forecast
- SIDC 10.7cm Solar radio flux (F10.7) forecast archive
- F10.7 Index Forecast 27-day/BGS
- F10.7 Index Forecast multi-year
- F10.7 Index Forecast 27-day/SWPC
- F10.7 Index Forecast 45-day
- F10.7 Index Forecast 30-day Absolute
- F10.7 Index Forecast 30-day Adjusted
Solar X-ray Flux
No product available in this category yet
Solar EUV Integrated Flux
No product available in this category yet
Solar UV Flux
No product available in this category yet
Geomagnetic indices, Nowcast
Local External Magnetic Field on Ground
Local Geomagnetic Induced Geoelectric Field
- Horizontal electric field data (UK)
- Peak Geomagnetically Induced Current (GIC) for Scotland, England, Wales and the UK
- Average Geomagnetically Induced Current (GIC) for Scotland, England, Wales and the UK
- Peak Pipe-to-Soil Potential (PSP) for Scotland, England, Wales and the UK
- Average Pipe-to-Soil Potential (PSP) for Scotland, England, Wales and the UK
- 3-hourly Telluric index (Lerwick, Eskdalemuir, Hartland)
- GIC Index, Bgic for the UK
- Modelled surface electric field for UK and Ireland
- Maps for power and pipeline operators
- Table of modelled GIC
- Pipe-to-soil voltage (PSV)
Geomagnetic indices, Forecast
Local External Magnetic Field on Ground
Local Geomagnetic Induced Geoelectric Field
No product available in this category yet
Alerts
Ionospheric Disturbance Detection
Tools
User Manual
While quiet ionospheric conditions are considered in many applications, disturbed conditions limit the functionality and availability of most systems. Prominent ionospheric perturbations are e.g.
- The ionospheric trough: an electron density depletion near the auroral region.
- Ionospheric patches: very localised regions with strong electron density deviations. Patches occur predominantly in the polar regions.
- Travelling Ionospheric Disturbances (TID): TIDs are signatures of atmospheric gravity waves. The atmospheric waves cause perturbations in the winds and density of the thermosphere, which is impacting the electron density.
- Depletions: Electron density depletions in mid-latitudes often occur during high geomagnetic activity. They are related to mid-latitude spread-F plumes (or plasma bubbles).
- D-region absorption: the D-region describes the lower ionosphere at about 80 km altitude. Enhancement of the D-region electron density can cause absorption of high frequency (HF) radio waves used for long-range communication. These D-region electron density enhancements can be primarily attributed to solar flares (X-ray) and radiation storms.
Interruptions
None

