
Current Space Weather
Solar Data
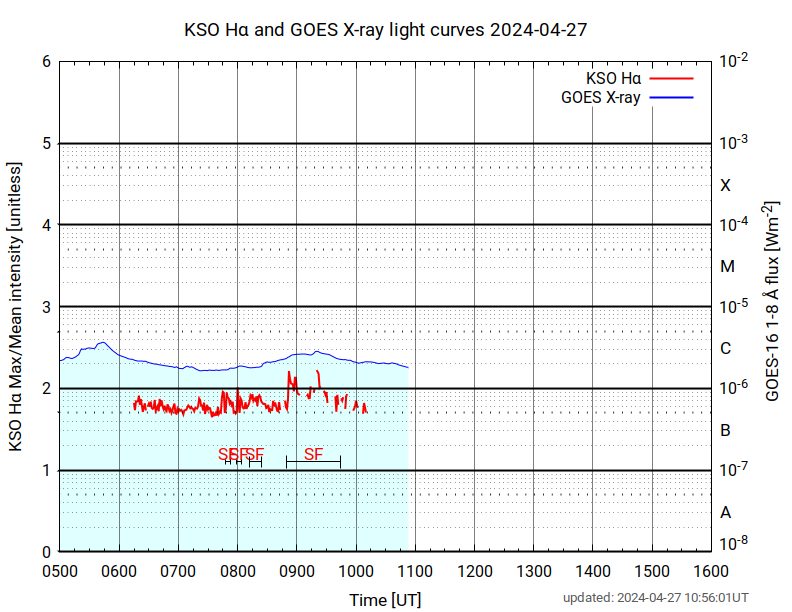
Full product
Provided by: Kanzelhöhe Observatory for Solar and Environmental Research
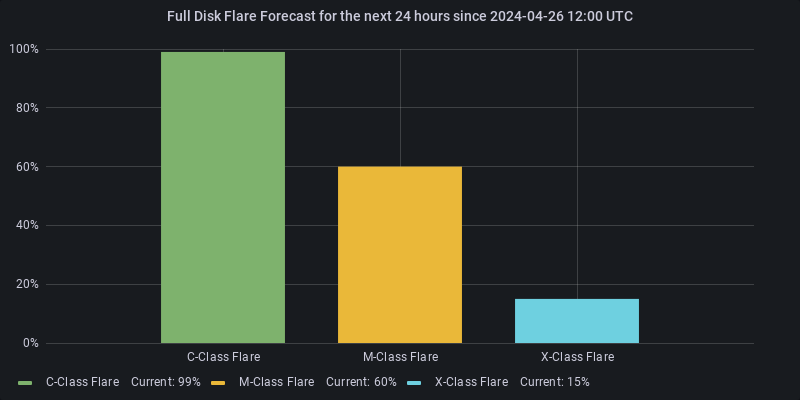
Full product
Provided by: Solar Influences Data analysis Center
Interplanetary medium
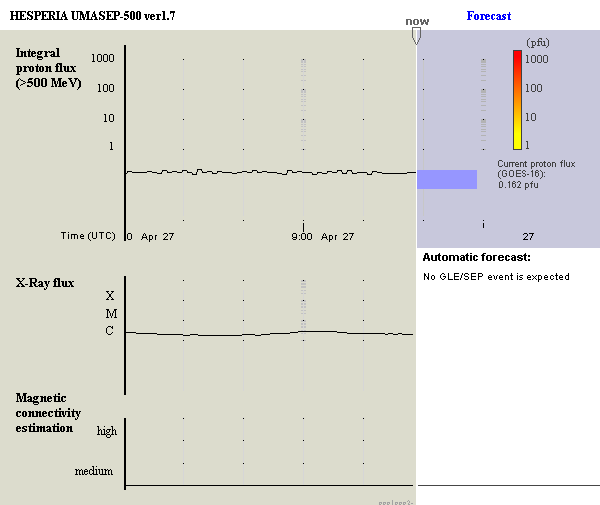
Full product
Provided by: Institute for Astronomy, Astrophysics, Space Applications & Remote Sensing
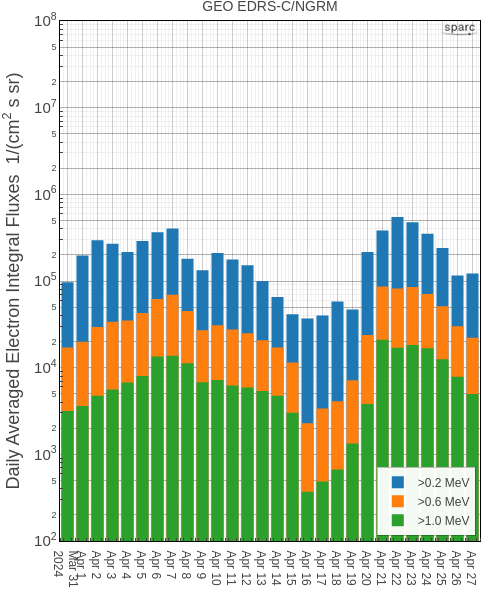
Earth's Magnetosphere and Radiation Belt
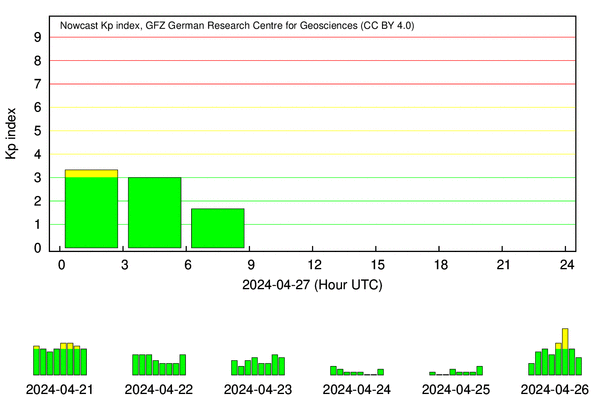
Full product
Provided by: GFZ Helmholtz Centre for Geosciences

Full product
Provided by: Seibersdorf Laboratories
Full product
Provided by: Space Applications & Research Consultancy
Earth's Ionosphere and Thermosphere
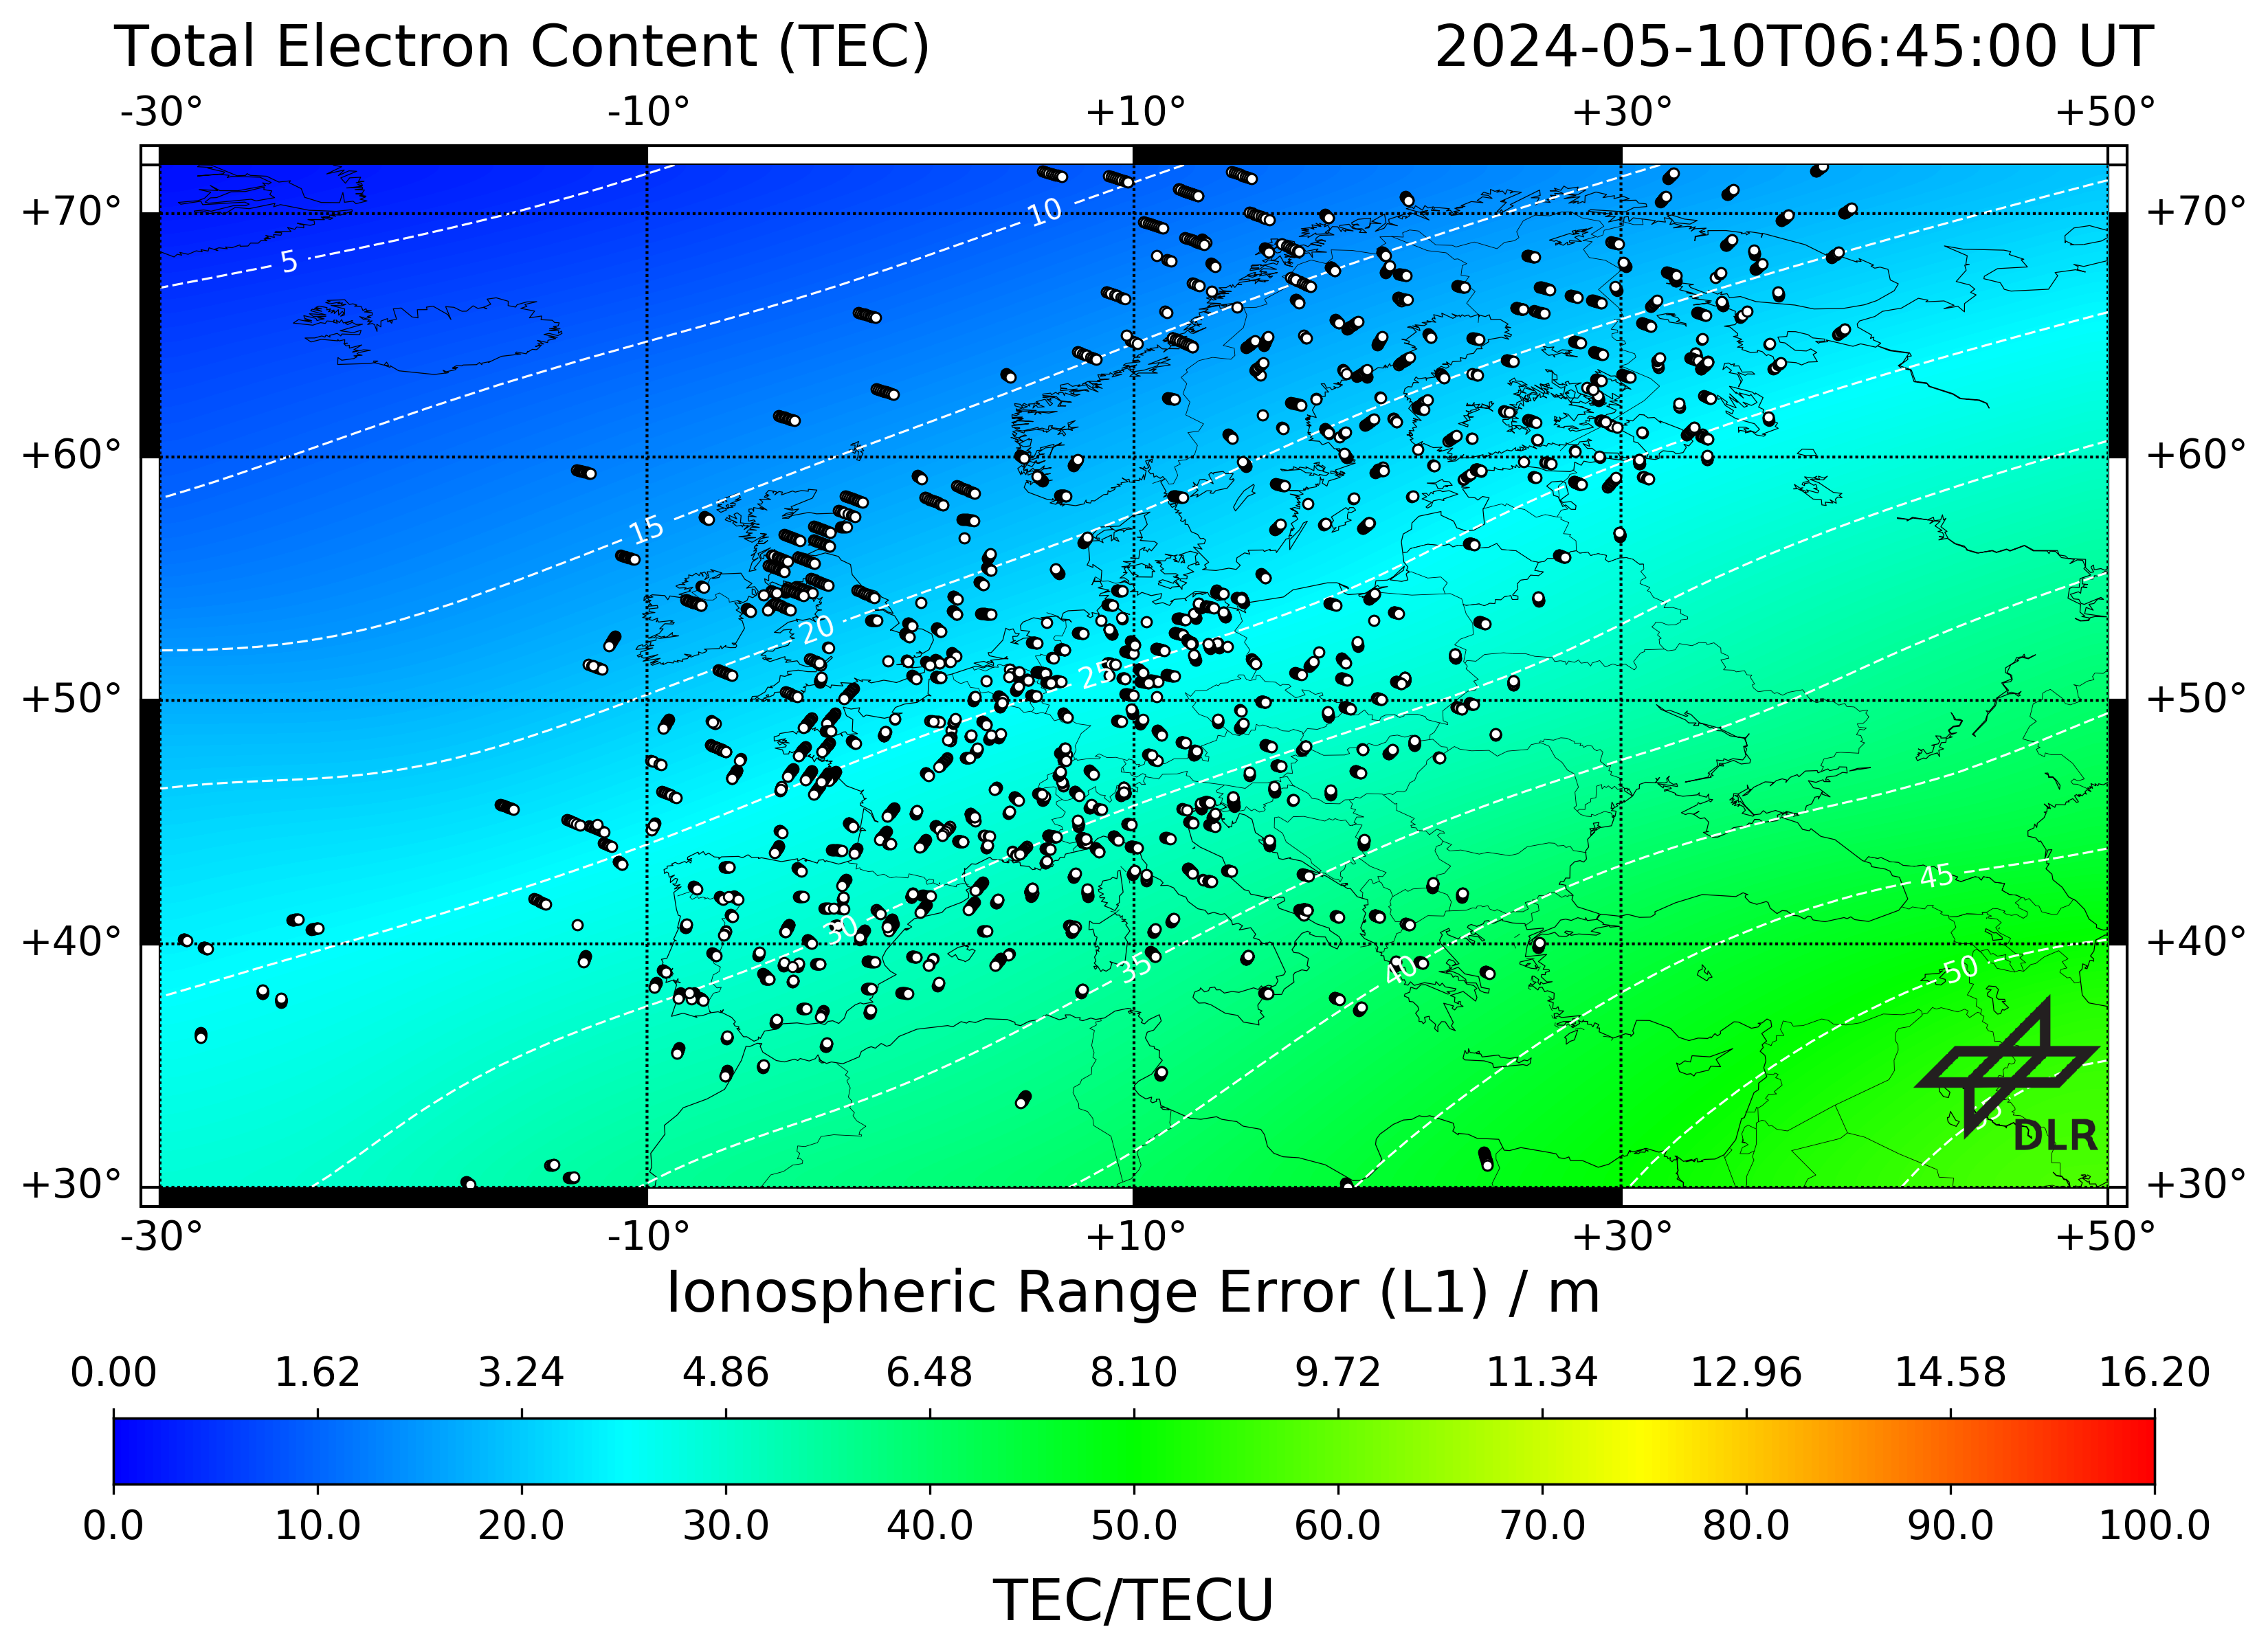
Full product
Provided by: German Aerospace Center
Earth's Atmosphere and Geomagnetic Environment
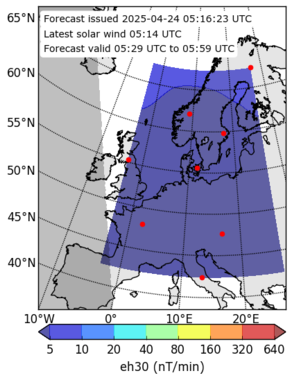
Full product
Provided by: Swedish Institute of Space Physics